January 2025 · U.S. economy · Monthly recap
A more expensive start to the year
Prices picked up, hiring continued, and the Fed kept borrowing costs on hold.
January began with a familiar squeeze: everyday costs were still rising, even while employers kept adding jobs. The month’s reports did not tell a story of an economy that had stopped working. They showed an economy where earning money and keeping its buying power were two different challenges.
What happened to prices?
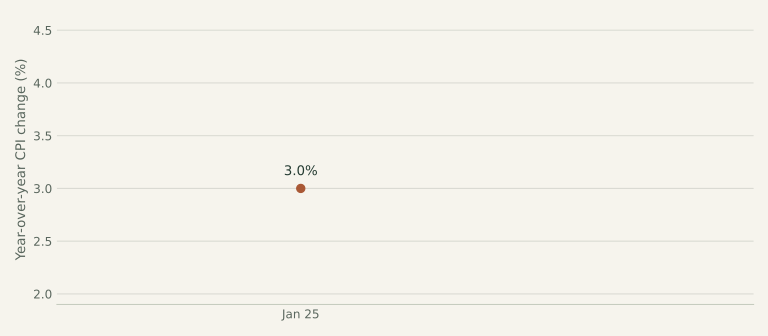
Consumer prices rose 0.5% over the month, after seasonal adjustment. The price basket was 3.0% higher than a year earlier, before seasonal adjustment. BLS price report.
View the chart data and sources
| Month | Annual CPI | Source |
|---|---|---|
| January 2025 | 3.0% | BLS release ↗ |
What happened to jobs?
The linked release reported 143,000 more nonfarm payroll jobs. The unemployment rate was 4.0%. BLS employment report.
What happened to interest rates?
The Federal Reserve held its target range at 4.25–4.50%. This is a benchmark for overnight bank lending, not the interest rate every consumer pays. Federal Reserve statement.
What this means in everyday life
A growing job market can help households bring in income, but income is only half of a budget. Rent, groceries, and transport determine how far that income goes. January’s combination is a useful reminder that a positive jobs headline does not automatically mean people feel financially comfortable.
One thing to keep in mind
The question heading into February was whether the faster monthly price increase would repeat. One hot reading can be a bump; several in a row would be a more persistent problem.
From the headlines to the classroom
AP Macro & Micro connections
Inflation, purchasing power & opportunity cost
AP Macro · Unit 2 · Economic Indicators and the Business Cycle
Use the reported annual CPI change to distinguish the price level from the inflation rate. A falling inflation rate can coexist with rising prices. Compare a nominal pay increase with inflation to see whether purchasing power improved.
AP Micro · Unit 1 · Basic Economic Concepts
A household has limited income and competing uses for it. If essentials take a larger share of the budget, the opportunity cost of other purchases becomes more visible. This is a household tradeoff, not proof that a particular market’s demand curve shifted.
Try it yourself
Suppose nominal pay rises 2% while the price level rises 3%. Does purchasing power rise or fall? What is the approximate real pay change?
Reveal the explanation
It falls. The approximation is nominal pay growth minus inflation: 2% − 3% = −1%. The exact calculation is (1.02 ÷ 1.03 − 1) × 100, about −0.97%. These are hypothetical pay figures, not a claim about the month’s actual wage growth.
Sources & reporting notes
BLS Consumer Price Index — January 2025 ↗BLS Employment Situation — January 2025 ↗Federal Reserve decision — January 2025 ↗This is a retrospective, researched on October 6, 2026. Figures describe the month named above, unless a different period is stated. CPI and employment values are as reported in the linked archived releases; later revisions may differ. This recap focuses on prices, jobs, interest-rate decisions, and selected policy changes. It is educational, not personalized financial advice.
Check your understanding
The three-question quiz
One question about the recap, one about AP Macro, and one about AP Micro. These are original learning questions.