April 2025 · U.S. economy · Monthly recap
Tariffs made the economic picture harder to read
New trade measures changed the outlook even as the month’s inflation reading remained modest.
April was a month when policy headlines and economic data needed to be read separately. New tariff announcements changed the rules for many imported goods. At the same time, the month’s consumer-price data showed only a modest overall increase. Those facts can both be true.
What happened to prices?
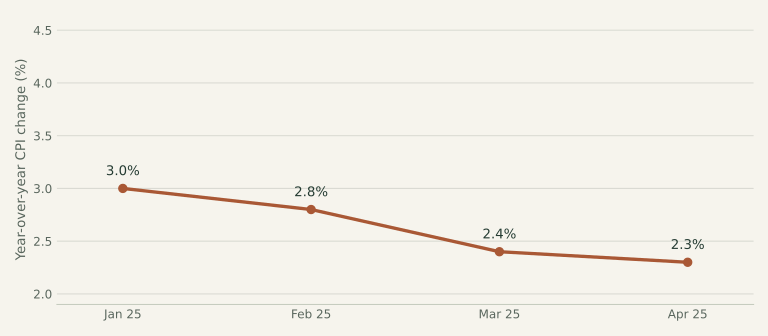
Consumer prices rose 0.2% over the month, after seasonal adjustment. The price basket was 2.3% higher than a year earlier, before seasonal adjustment. BLS price report.
View the chart data and sources
| Month | Annual CPI | Source |
|---|---|---|
| January 2025 | 3.0% | BLS release ↗ |
| February 2025 | 2.8% | BLS release ↗ |
| March 2025 | 2.4% | BLS release ↗ |
| April 2025 | 2.3% | BLS release ↗ |
What happened to jobs?
The linked release reported 177,000 more nonfarm payroll jobs. The unemployment rate was 4.2%. BLS employment report.
What changed in trade policy
The April 2 order introduced an additional 10% baseline tariff on many imports, with exceptions, plus higher country-specific rates. An April 9 order temporarily suspended many of those higher rates for 90 days, while retaining the 10% additional rate for covered trading partners; China was treated separately. The rules changed during the month, so a single tariff percentage does not describe every import.
April 2 executive order ↗April 9 executive order ↗What this means in everyday life
A tariff is a tax on an imported product, paid to the government by the importer. Businesses may absorb some of the cost, seek another supplier, or pass some on through prices. That process takes time and varies by product. April’s CPI number cannot, by itself, tell us the eventual effect of the new trade measures.
One thing to keep in mind
Separate an announced policy from an observed result. Look for evidence in later product prices and business decisions before claiming that a tariff caused a specific change in inflation.
From the headlines to the classroom
AP Macro & Micro connections
Tariffs, imports & economic welfare
AP Macro · Unit 6 · Open Economy—International Trade and Finance
The recap’s trade-policy changes provide a starting point for thinking about imports and cross-border exchange. A tariff is not the same as an exchange-rate change. Do not infer an exchange-rate outcome from a tariff announcement alone.
AP Micro · Unit 2 · Supply and Demand
In the standard small-country model, a tariff raises the domestic price of an imported good, increases domestic production, reduces domestic consumption and imports, and creates government revenue and deadweight loss. The world price is assumed unchanged.
Try it yourself
In a small-country import-market graph, a tariff raises the domestic price above the world price. What happens to consumer surplus, domestic producer surplus, and imports?
Reveal the explanation
Consumer surplus falls, domestic producer surplus rises, and imports fall. The government receives tariff revenue. Net national welfare falls by the deadweight-loss areas in the basic model. State the assumptions: a small country, competitive markets, and no other market failures.
Sources & reporting notes
BLS Consumer Price Index — April 2025 ↗BLS Employment Situation — April 2025 ↗April 2 executive order ↗April 9 executive order ↗This is a retrospective, researched on October 6, 2026. Figures describe the month named above, unless a different period is stated. CPI and employment values are as reported in the linked archived releases; later revisions may differ. This recap focuses on prices, jobs, interest-rate decisions, and selected policy changes. It is educational, not personalized financial advice.
Check your understanding
The three-question quiz
One question about the recap, one about AP Macro, and one about AP Micro. These are original learning questions.