September 2026 · U.S. economy · Monthly recap
The Fed raised rates as inflation stayed elevated
A policy-rate increase, modest job growth, and spending data defined the latest recap.
September brought a reversal in the policy-rate direction. The Federal Reserve raised its target range by a quarter of a percentage point. Its statement said inflation remained elevated. The month’s jobs report, released on October 2, later showed only a small payroll gain.
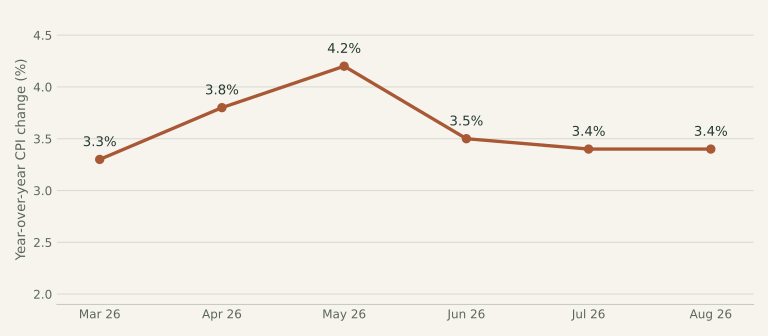
View the chart data and sources
| Month | Annual CPI | Source |
|---|---|---|
| March 2026 | 3.3% | BLS release ↗ |
| April 2026 | 3.8% | BLS release ↗ |
| May 2026 | 4.2% | BLS release ↗ |
| June 2026 | 3.5% | BLS release ↗ |
| July 2026 | 3.4% | BLS release ↗ |
| August 2026 | 3.4% | BLS release ↗ |
What happened to jobs?
The linked release reported 29,000 more nonfarm payroll jobs. The unemployment rate was 4.2%. BLS employment report.
What happened to interest rates?
The Federal Reserve raised its target range by 0.25 percentage point, to 3.75–4.00%. This is a benchmark for overnight bank lending, not the interest rate every consumer pays. Federal Reserve statement.
The spending report released in September
BEA’s September 30 release reported that August consumer spending rose 0.9% in dollar terms and 0.6% after adjusting for prices. August’s PCE inflation rate was 3.4% over twelve months. PCE and CPI are different measures with different coverage and weights; one cannot be substituted for the other without explanation.
BEA: August 2026 income and spending ↗BLS: August CPI and September release date ↗What this means in everyday life
Higher policy rates can raise some borrowing costs and support higher savings yields, though the effects differ by product. The move also highlights the Fed’s balancing act: supporting employment while bringing inflation toward its goal. Strong spending does not necessarily mean every household is better off; national totals combine many different situations.
One thing to keep in mind
This recap was prepared on October 6. September CPI was not yet available: BLS scheduled that release for October 14. The spending and PCE inflation figures discussed below describe August, were released in September, and should not be mistaken for September’s own inflation reading.
From the headlines to the classroom
AP Macro & Micro connections
Contractionary monetary policy & financing costs
AP Macro · Unit 4 · Financial Sector; 3 · National Income and Price Determination
September’s rate increase illustrates a contractionary monetary-policy action. If higher borrowing costs reduce spending, aggregate demand shifts left in the basic short-run model. Distinguish the model’s prediction from a claim that it has already occurred.
AP Micro · Unit 3 · Production, Cost, and the Perfect Competition Model
A higher financing cost can make a prospective investment less attractive to a firm. Different firms face different loan rates and expected returns, so a policy-rate increase does not imply an identical response across every business.
Try it yourself
Assume higher rates reduce investment, with SRAS unchanged. Show the effect on aggregate demand, the price level, and real output.
Reveal the explanation
AD shifts left. The price level and real output decrease in the short-run model. A lower price level relative to the no-policy counterfactual is not a guarantee that observed consumer prices will fall, because other shocks may occur at the same time.
Sources & reporting notes
BLS Employment Situation — September 2026 ↗Federal Reserve decision — September 2026 ↗BEA: August 2026 income and spending ↗BLS: August CPI and September release date ↗This is a retrospective, researched on October 6, 2026. Figures describe the month named above, unless a different period is stated. CPI and employment values are as reported in the linked archived releases; later revisions may differ. This recap focuses on prices, jobs, interest-rate decisions, and selected policy changes. It is educational, not personalized financial advice.
Check your understanding
The three-question quiz
One question about the recap, one about AP Macro, and one about AP Micro. These are original learning questions.