June 2025 · U.S. economy · Monthly recap
Inflation picked up again
Prices rose faster than in May, while the Fed waited and the initial jobs report showed gains.
June interrupted the run of softer monthly inflation readings. The increase was not a return to the fastest price growth of earlier years, but it did mean the cost-of-living problem had not disappeared. The first employment report for the month still showed hiring.
What happened to prices?
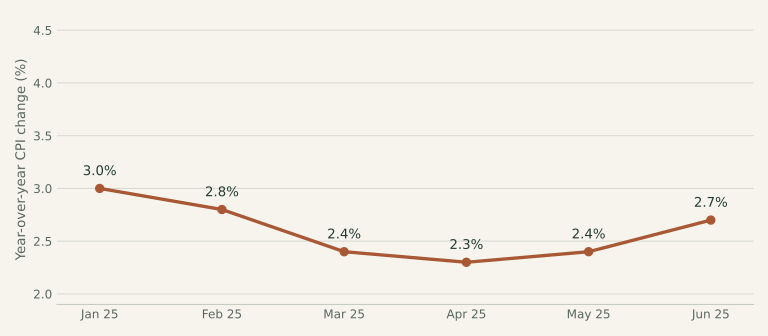
Consumer prices rose 0.3% over the month, after seasonal adjustment. The price basket was 2.7% higher than a year earlier, before seasonal adjustment. BLS price report.
View the chart data and sources
| Month | Annual CPI | Source |
|---|---|---|
| January 2025 | 3.0% | BLS release ↗ |
| February 2025 | 2.8% | BLS release ↗ |
| March 2025 | 2.4% | BLS release ↗ |
| April 2025 | 2.3% | BLS release ↗ |
| May 2025 | 2.4% | BLS release ↗ |
| June 2025 | 2.7% | BLS release ↗ |
What happened to jobs?
The linked release reported 147,000 more nonfarm payroll jobs. The unemployment rate was 4.1%. BLS employment report.
What happened to interest rates?
The Federal Reserve held its target range at 4.25–4.50%. This is a benchmark for overnight bank lending, not the interest rate every consumer pays. Federal Reserve statement.
What this means in everyday life
For a household, inflation adds pressure even when the percentage looks small. A series of small increases can build into a noticeably larger bill. Meanwhile, a national job gain does not tell every worker’s story. The industries doing the hiring, hours available, and local conditions all matter.
One thing to keep in mind
June’s jobs numbers are presented here as reported in the linked release. Employment estimates are revised as more survey information arrives, so a first reading is a snapshot rather than a final count.
From the headlines to the classroom
AP Macro & Micro connections
Unemployment & derived demand for labor
AP Macro · Unit 2 · Economic Indicators and the Business Cycle
Payroll growth and the unemployment rate measure different things. Use the recap to practice describing both without treating them as interchangeable. The labor force includes employed people and unemployed people who are actively looking and available for work.
AP Micro · Unit 5 · Factor Markets
A firm’s demand for workers is derived from demand for what those workers produce. In a competitive labor market, a change in the marginal revenue product of labor can shift labor demand. A national payroll number alone does not identify that shift for a particular firm.
Try it yourself
Assume demand for a restaurant’s meals increases, its output price rises, and each worker’s productivity is unchanged. What happens to marginal revenue product and the restaurant’s labor demand?
Reveal the explanation
Marginal revenue product rises because each worker’s output earns more revenue. Labor demand shifts right. With an upward-sloping labor supply curve and other factors unchanged, equilibrium wage and employment rise. This is a simplified firm/market example, not a causal finding about all jobs in the recap.
Sources & reporting notes
BLS Consumer Price Index — June 2025 ↗BLS Employment Situation — June 2025 ↗Federal Reserve decision — June 2025 ↗This is a retrospective, researched on October 6, 2026. Figures describe the month named above, unless a different period is stated. CPI and employment values are as reported in the linked archived releases; later revisions may differ. This recap focuses on prices, jobs, interest-rate decisions, and selected policy changes. It is educational, not personalized financial advice.
Check your understanding
The three-question quiz
One question about the recap, one about AP Macro, and one about AP Micro. These are original learning questions.