July 2025 · U.S. economy · Monthly recap
Hiring slowed while tax rules changed
The initial payroll gain was smaller, inflation stayed above zero, and a major law was enacted.
July combined a softer hiring report with a major change in federal policy. The initial jobs estimate showed a smaller gain than June’s initial estimate. Prices continued to rise. Separately, a new federal law changed parts of the tax system, making July important beyond its monthly economic numbers.
What happened to prices?
Consumer prices rose 0.2% over the month, after seasonal adjustment. The price basket was 2.7% higher than a year earlier, before seasonal adjustment. BLS price report.
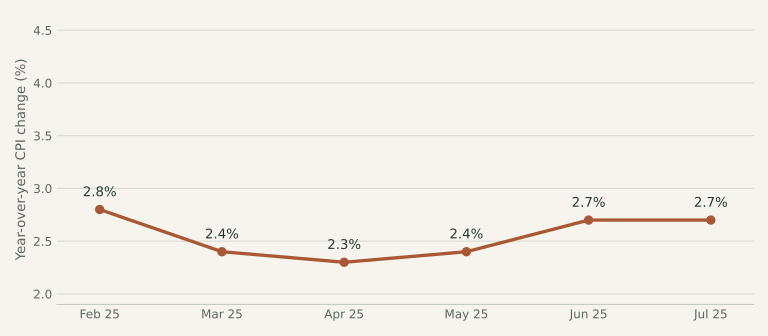
View the chart data and sources
| Month | Annual CPI | Source |
|---|---|---|
| February 2025 | 2.8% | BLS release ↗ |
| March 2025 | 2.4% | BLS release ↗ |
| April 2025 | 2.3% | BLS release ↗ |
| May 2025 | 2.4% | BLS release ↗ |
| June 2025 | 2.7% | BLS release ↗ |
| July 2025 | 2.7% | BLS release ↗ |
What happened to jobs?
The linked release reported 73,000 more nonfarm payroll jobs. The unemployment rate was 4.2%. BLS employment report.
What happened to interest rates?
The Federal Reserve held its target range at 4.25–4.50%. This is a benchmark for overnight bank lending, not the interest rate every consumer pays. Federal Reserve statement.
A policy change to know
Public Law 119-21 was enacted on July 4. The IRS’s July fact sheet described new deductions involving qualified tips, qualified overtime, certain car-loan interest, and eligible seniors, subject to specific requirements and limits. These were targeted tax provisions, not a blanket promise that every household would receive the same benefit.
Public Law 119-21 ↗IRS July 2025 fact sheet ↗What this means in everyday life
Slower hiring can make it harder to find a new role even when most people already in work remain employed. Tax changes affect a different part of household finances: how much income remains after taxes. A tax deduction reduces taxable income; it is not the same thing as receiving that amount in cash.
One thing to keep in mind
Treat a payroll estimate as subject to revision, and treat tax headlines as a starting point for checking eligibility. A broad policy label rarely tells you how a rule applies to a particular household.
From the headlines to the classroom
AP Macro & Micro connections
Fiscal policy, tax incentives & incidence
AP Macro · Unit 3 · National Income and Price Determination
Tax changes can affect disposable income and spending. In a simplified model, a tax reduction that raises consumption can shift AD right, all else equal. Eligibility, timing, saving behavior, and other policy changes determine the actual response.
AP Micro · Unit 2 · Supply and Demand; 6 · Market Failure and the Role of Government
Tax rules affect incentives, but a personal income-tax deduction is not the same as a per-unit tax on a product. For a per-unit tax, the less elastic side of the market bears more of the economic burden. Do not use that product-market graph as an exact model of every tax provision.
Try it yourself
In a hypothetical product market, demand is less elastic than supply. Who bears more of a new per-unit tax: buyers or sellers?
Reveal the explanation
Buyers bear more of the burden because their quantity demanded responds less to price. This depends on relative elasticities, not on which side legally sends the tax payment. This example is about a per-unit product tax, not the income-tax provisions in July’s law.
Sources & reporting notes
BLS Consumer Price Index — July 2025 ↗BLS Employment Situation — July 2025 ↗Federal Reserve decision — July 2025 ↗Public Law 119-21 ↗IRS July 2025 fact sheet ↗This is a retrospective, researched on October 6, 2026. Figures describe the month named above, unless a different period is stated. CPI and employment values are as reported in the linked archived releases; later revisions may differ. This recap focuses on prices, jobs, interest-rate decisions, and selected policy changes. It is educational, not personalized financial advice.
Check your understanding
The three-question quiz
One question about the recap, one about AP Macro, and one about AP Micro. These are original learning questions.