October 2025 · U.S. economy · Monthly recap
A rate cut during a gap in economic data
The Fed eased again while the shutdown interrupted key monthly reports.
October stands out because part of the normal economic dashboard was missing. The lapse in federal funding disrupted the collection and publication of important statistics. The Federal Reserve still made an interest-rate decision, but readers should resist filling the missing data with guesses.
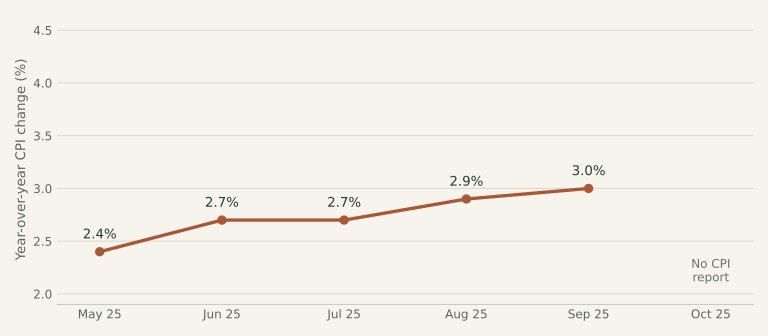
View the chart data and sources
| Month | Annual CPI | Source |
|---|---|---|
| May 2025 | 2.4% | BLS release ↗ |
| June 2025 | 2.7% | BLS release ↗ |
| July 2025 | 2.7% | BLS release ↗ |
| August 2025 | 2.9% | BLS release ↗ |
| September 2025 | 3.0% | BLS release ↗ |
| October 2025 | Not available | BLS release ↗ |
What happened to interest rates?
The Federal Reserve cut its target range by 0.25 percentage point, to 3.75–4.00%. This is a benchmark for overnight bank lending, not the interest rate every consumer pays. Federal Reserve statement.
What we know—and what is missing
BLS did not publish an October 2025 CPI release. Its November report explained that October survey data had not been collected and could not be collected retroactively. BLS’s employment archive likewise lists no standalone October Employment Situation release. Later releases supplied some employment information, but there was no normal October household-survey reading.
BLS CPI archive ↗BLS November CPI release and shutdown notes ↗BLS employment archive ↗What this means in everyday life
Economic statistics are built from surveys and other measurements. They are not simply numbers a government can recreate perfectly after the fact. When a month’s survey data is missing, the honest result may be a gap. That makes comparisons harder for households, businesses, and policymakers alike.
One thing to keep in mind
A blank inflation value is not zero inflation. It means the usual headline measurement was unavailable. Keep October separate when comparing the surrounding months, and check the notes attached to later reports.
From the headlines to the classroom
AP Macro & Micro connections
Measurement, missing data & model assumptions
AP Macro · Unit 2 · Economic Indicators and the Business Cycle
A missing CPI or unemployment reading is not a value of zero. Know which period a percentage covers before comparing it with another report. This recap is practice in interpreting economic indicators honestly.
AP Micro · Unit 1 · Basic Economic Concepts
Economic models use assumptions to isolate relationships. Missing observations cannot be replaced with a convenient assumption and then presented as measured facts. Separate a hypothetical model example from what the available evidence actually says.
Try it yourself
A price index is 100 in September and 100.2 in November, but October is missing. Can you calculate November’s one-month inflation rate?
Reveal the explanation
No. You can calculate a 0.2% cumulative increase from September to November, but the November one-month rate requires October’s index. Many different October values could produce the same two-month change.
Sources & reporting notes
Federal Reserve decision — October 2025 ↗BLS CPI archive ↗BLS November CPI release and shutdown notes ↗BLS employment archive ↗This is a retrospective, researched on October 6, 2026. Figures describe the month named above, unless a different period is stated. CPI and employment values are as reported in the linked archived releases; later revisions may differ. This recap focuses on prices, jobs, interest-rate decisions, and selected policy changes. It is educational, not personalized financial advice.
Check your understanding
The three-question quiz
One question about the recap, one about AP Macro, and one about AP Micro. These are original learning questions.