July 2026 · U.S. economy · Monthly recap
Calmer inflation, softer payrolls
Prices rose only slightly, while payrolls edged lower and the Fed kept rates steady.
July’s price reading was much calmer than the spring’s increases. At the same time, the initial payroll estimate showed a small decline. It was another mixed month: less new price pressure, but an employment number that called for a closer look.
What happened to prices?
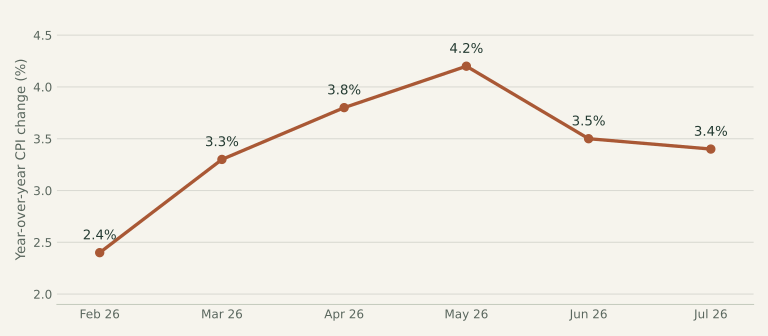
Consumer prices rose 0.1% over the month, after seasonal adjustment. The price basket was 3.4% higher than a year earlier, before seasonal adjustment. BLS price report.
View the chart data and sources
| Month | Annual CPI | Source |
|---|---|---|
| February 2026 | 2.4% | BLS release ↗ |
| March 2026 | 3.3% | BLS release ↗ |
| April 2026 | 3.8% | BLS release ↗ |
| May 2026 | 4.2% | BLS release ↗ |
| June 2026 | 3.5% | BLS release ↗ |
| July 2026 | 3.4% | BLS release ↗ |
What happened to jobs?
The linked release reported 23,000 fewer nonfarm payroll jobs. The unemployment rate was 4.1%. BLS employment report.
What happened to interest rates?
The Federal Reserve held its target range at 3.50–3.75%. This is a benchmark for overnight bank lending, not the interest rate every consumer pays. Federal Reserve statement.
What this means in everyday life
The unemployment rate and payroll change do not always move together. They come from different surveys and measure different things: one looks at people’s labor-force status, the other at jobs on employer payrolls. A small payroll decline alongside a lower reported unemployment rate is therefore possible, rather than evidence that one number must be wrong.
One thing to keep in mind
BLS described the overall employment change as small. Revisions and the next few reports matter more than assigning a sweeping label to one month.
From the headlines to the classroom
AP Macro & Micro connections
Different surveys, different labor-market measures
AP Macro · Unit 2 · Economic Indicators and the Business Cycle
July’s payroll estimate and unemployment rate moved in different directions. They are based on different surveys: employers report payroll jobs, while households report people’s labor-force status. One person can also hold more than one job.
AP Micro · Unit 5 · Factor Markets
A national net job change combines many markets. In a particular labor market, demand is derived from workers’ marginal revenue product. Aggregating gains and losses does not tell us which firm-level supply or demand curves shifted.
Try it yourself
A person adds a second job while already employed. How can that affect payroll employment and the unemployment rate differently?
Reveal the explanation
The additional payroll job can increase the employer-survey job count. In the household survey, the person was already employed, so adding the second job need not change the unemployment rate. Assume nothing else changes.
Sources & reporting notes
BLS Consumer Price Index — July 2026 ↗BLS Employment Situation — July 2026 ↗Federal Reserve decision — July 2026 ↗This is a retrospective, researched on October 6, 2026. Figures describe the month named above, unless a different period is stated. CPI and employment values are as reported in the linked archived releases; later revisions may differ. This recap focuses on prices, jobs, interest-rate decisions, and selected policy changes. It is educational, not personalized financial advice.
Check your understanding
The three-question quiz
One question about the recap, one about AP Macro, and one about AP Micro. These are original learning questions.