August 2025 · U.S. economy · Monthly recap
A tougher combination: rising prices, little hiring
Monthly inflation accelerated while the initial payroll report showed only a small gain.
August’s two headline reports pulled household finances in an uncomfortable direction. The overall price basket rose more quickly than in July, while the first jobs estimate showed little employment growth. That combination matters because higher bills are easier to handle when opportunities and income are expanding.
What happened to prices?
Consumer prices rose 0.4% over the month, after seasonal adjustment. The price basket was 2.9% higher than a year earlier, before seasonal adjustment. BLS price report.
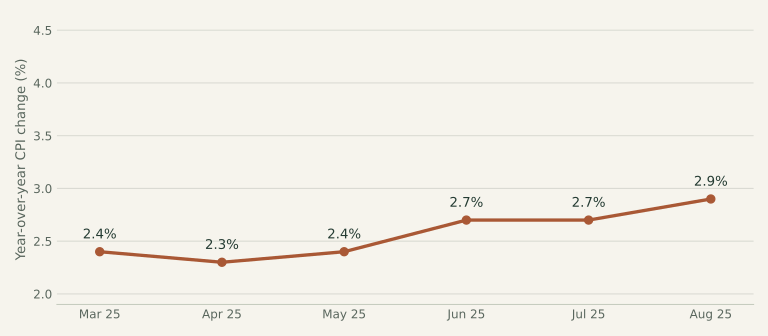
View the chart data and sources
| Month | Annual CPI | Source |
|---|---|---|
| March 2025 | 2.4% | BLS release ↗ |
| April 2025 | 2.3% | BLS release ↗ |
| May 2025 | 2.4% | BLS release ↗ |
| June 2025 | 2.7% | BLS release ↗ |
| July 2025 | 2.7% | BLS release ↗ |
| August 2025 | 2.9% | BLS release ↗ |
What happened to jobs?
The linked release reported 22,000 more nonfarm payroll jobs. The unemployment rate was 4.3%. BLS employment report.
What this means in everyday life
A small national payroll gain is not the same thing as mass unemployment. It measures the net change in jobs, after gains and losses are combined. But a slower pace can mean fewer openings for people trying to enter the workforce or switch employers. At the same time, the inflation index is an average, not a precise measure of any one family’s bills.
One thing to keep in mind
Look for a pattern across several employment reports, including revisions. A weak month can signal caution without proving that the entire economy is shrinking.
From the headlines to the classroom
AP Macro & Micro connections
Unemployment & derived demand for labor
AP Macro · Unit 2 · Economic Indicators and the Business Cycle
Payroll growth and the unemployment rate measure different things. Use the recap to practice describing both without treating them as interchangeable. The labor force includes employed people and unemployed people who are actively looking and available for work.
AP Micro · Unit 5 · Factor Markets
A firm’s demand for workers is derived from demand for what those workers produce. In a competitive labor market, a change in the marginal revenue product of labor can shift labor demand. A national payroll number alone does not identify that shift for a particular firm.
Try it yourself
Assume demand for a restaurant’s meals increases, its output price rises, and each worker’s productivity is unchanged. What happens to marginal revenue product and the restaurant’s labor demand?
Reveal the explanation
Marginal revenue product rises because each worker’s output earns more revenue. Labor demand shifts right. With an upward-sloping labor supply curve and other factors unchanged, equilibrium wage and employment rise. This is a simplified firm/market example, not a causal finding about all jobs in the recap.
Sources & reporting notes
BLS Consumer Price Index — August 2025 ↗BLS Employment Situation — August 2025 ↗This is a retrospective, researched on October 6, 2026. Figures describe the month named above, unless a different period is stated. CPI and employment values are as reported in the linked archived releases; later revisions may differ. This recap focuses on prices, jobs, interest-rate decisions, and selected policy changes. It is educational, not personalized financial advice.
Check your understanding
The three-question quiz
One question about the recap, one about AP Macro, and one about AP Micro. These are original learning questions.